What is APHLIS?
APHLIS is a source of information on the postharvest losses (PHLs) of cereals. It has special relevance to the current situation where agriculture is being challenged to produce ever more food for a rapidly growing world population in the face of limited physical resources and the negative impacts of climate change. This is because reducing the losses that occur in the postharvest chain for cereals offers a resource efficient means of increasing food availability without further use of land, water and other agricultural inputs. Reliable PHL figures are essential for better targeting of loss reduction programmes, monitoring the success of these programmes and estimating food availability in countries threatened by food insecurity.
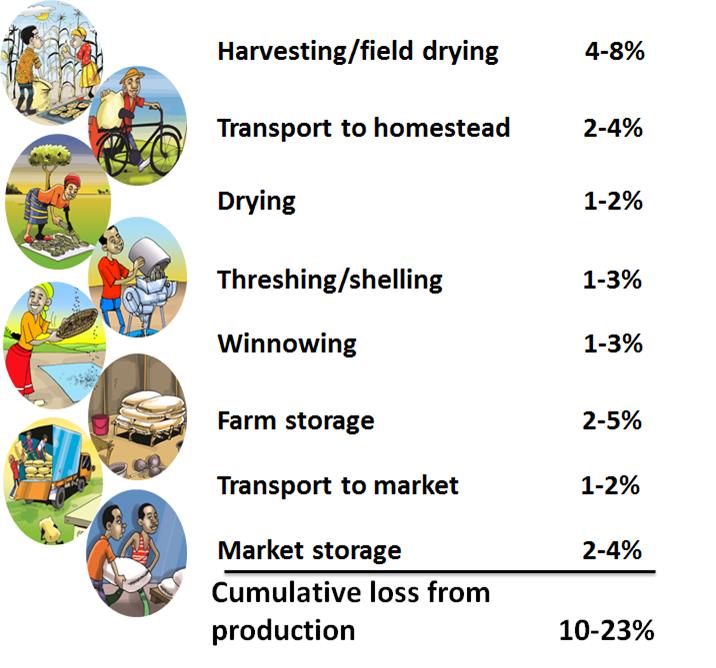
Typical weight loss ranges for links in the postharvest chain for cereal grains in Sub-Saharan Africa
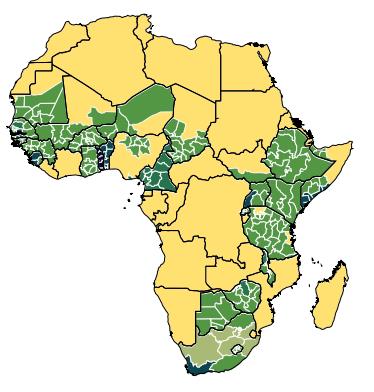
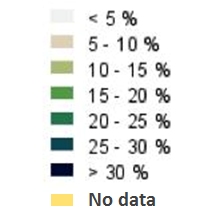
APHLIS integrates a network of local experts who supply data, a shared database and a Losses Calculator. Working together these generate estimates of the weight losses of cereal grains in Sub-Saharan Africa by country and by province. The estimates can be viewed as maps or as tables of loss values.
|
Maize % weight losses 2012 |
|
|
||||||||||||||||||||||||||||||||||||
What does APHLIS offer?
- APHLIS provides a downloadable version of its loss calculator as an Excel spreadsheet. Users can change default values to those relevant to their situation and generate PHL estimates for any geographical scale.
- APHLIS PHL tables can be ‘clicked’ to reveal a complete breakdown of the loss calculation, the sources of data and an appraisal of the quality of the data used. Users can subject PHL estimates to critical examination.
- APHLIS is easily upgraded as more reliable loss data become available. Users can contribute their loss data and, if it can be demonstrated to be better than existing data, will be added to the database.
- APHLIS offers ‘Country Narratives’ that give a context to loss data.
How does APHLIS estimate PHLosses?
Losses are estim ated using an algorithm (the PHL Calculator) that operates on two data sets, these are a set of postharvest loss profiles and a set of seasonal data.
The PHL profile - This is set of figures, one for each link in the postharvest chain, derived from the scientific literature. PHL profiles are specific to crop type, climate type and to the type of farm (smallholder or larger scale farming). One problem faced in seeking to provide PHL profiles is, that for many provinces there are no specific PHL data. It is therefore inevitable that many different provinces have to share the same data. This was achieved by clustering together the provinces of many countries that are basically similar with respect to the factors that influence PHLs; the most convenient method of doing this is regrouping of provinces according to climate classification, namely by tropical savannah, hot semi-arid, humid subtropical and subtropical highlands. As a result for each crop there is a PHL profile for each climate and farm type, so with eight crops there is a total of 36 profiles. Besides being
Seasonal data - Several ‘seasonal’ factors are taken into account in the loss calculation and these have a very significant bearing on the actual loss estimate. They are contributed by the APHLIS network members and include 1) whether or not there is damp weather at time of any of the harvests which would make drying difficult, 2) the proportion of grain that is marketed within the first three months, so will not enter farm storage for any significant time, 3) the length of the farm storage period, and 4) in the case of maize, whether or not LGB (Prostephanus truncatus) is expected to be a significant pest.

 English
 French


